Realtime Graphs
For WiFi clients (it is not shown for regular lan clients), the Realtime Graphs tab you can map incoming connections on different ports to ports on the client.
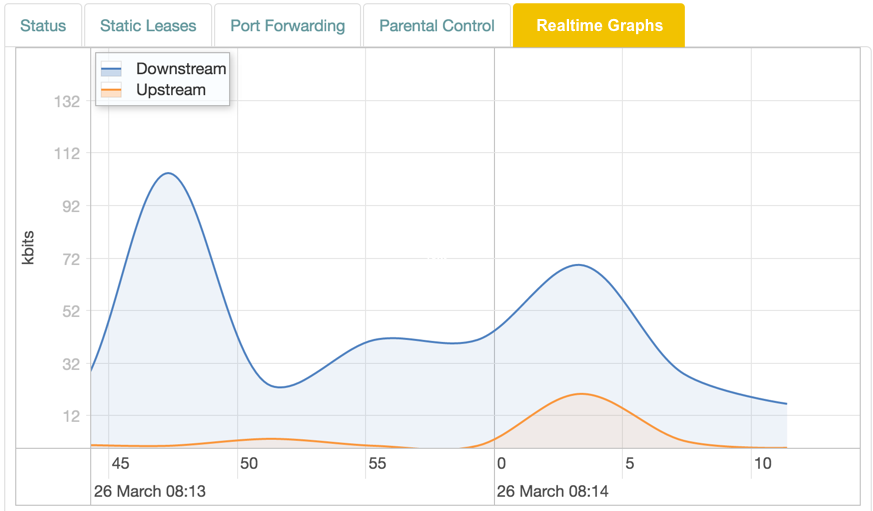
Graph
The display is shown in realtime, with lines representing traffic in kbit/s:
| Color | Traffic |
|---|---|
| Blue | Downstream. |
| Red | Upstream. |
Table
The table below the graph displays collected data since the tab was opened, and the total connection uptime since last downtime.
| Item | Description |
|---|---|
| Download Speed | Current download speed. |
| Upload Speed | Current upload speed. |
| Total Received Data | Downloaded data since the tab was opened. |
| Total Transmitted Data | Transmitted data since the tab was opened. |
| Total Uptime | Connection uptime since last downtime. |

